User manual
BactImAs User Manual
1. BactImAs GUI
Image below shows the BactImAs GUI.
GUI consists of three main parts:
 * R/G/B channel images, scrollable image panes showing every second frame of the experiment
 * Frame/cell tree on the right showing all frames and cells/ROIs
 * Status window showing messages from the program (can be minified)

If you chose (click) on a frame(on the tree or on the R/G/B channel image) a new image stack will appear showing that frame's images in all combinations: R, G, B, R+G, R+B, B+G, RGB, with annotated ROIs (you can turn off annotations using Roi Manager):

One can scroll to any of these and use it (typically) to assign ROIs using ImageJ polygon selection tool.
Every GUI command/option is described in detail below (also, note the table of contents on the upper right side).
2. Experiment
//**Note: please read the installation instructions first, especially the "BactImAs structure" part.**//
2.1. Setup new experiment
You must prepare, beforehand, three folders: red, green and blue (each containing image sequence of the appropriate channel). Images must be 8-bit PNGs, and must be named unanimously (having the same name, and increasing number at the end), e.g.:
 *         phase_image_0000.png
 *         phase_image_0001.png
 *         phase_image_0002.png
 *         ...
Don't worry, ImageJ will do this for you (by deafault), if you say File->Save As->Image sequence. Also, note that once you've processed the movie (i.e. performed cell segmentations) you can measure on a whole different set of images (typically original TIFFs), as long as the ROIs (cell selections) hit the same spot. These folders should not be moved afterwards (in this version) - the program will expect images to be at the same place when you (later) load the experiment. Should you move them, you'll have to edit the experiment properties and set the new file locations. In other words, images WILL NOT be saved to database, only the calculated/defined ROIs, measurements etc.
Once the folders are prepared (note that these can be stored anywhere (local hardrive, external server... but it is highly recommended to keep them in the default location under data/images folder). Start BactImAs.jar and select Experiment->New experiment. You will be asked to choose folders for each channel (“Red”, “Green” and “Blue”. (the location you define in this step will be saved but can be changed later if you decide to move the folders). Then you must give an unique name to your experiment. Next to this name, BactImAs automatically assigns exp. id (e.g. id 1076) that can be later used in SQL queries. BactImAs will then load images in a few sec and you are ready to start the time-lapse movie processing.
Optional: This is a good time to also define here some important experimental settings such as pixel size. However, you can also do it at any other time.
2.2. Load experiment
Use Experiment->Load ( Alt+2) to load an experiment. Pick an existing experiment and wait for the experiment to load. If you don't see the images on the R/G/B channels, that probably means that you haven't set up the folders right (see above), or you received a database from someone else and need to point the R/G/B folders to new locations. Either way:
2.3. Edit experiment (settings)
Once you've loaded the experiment you can change it's settings via Experiment->Edit current experiment (Alt+4). You'll get a dialog like this one:

The most common use case for changing the experiment settings is when someone sends you his or hers database and adjoining image files. Since they've probably stored the in the different folder (than you), you'll have to change this folder paths in order for the images to load.
2.4. Delete experiment
To delete the experiment chose Experiment->delete (Alt+3). This will not delete the image files on your disk, just the records in the database pertaining to that experiment.
3. Segmentation
Once you've set up your experiment, given it a name, and set the images folders, you may proceed to actual cell segmentation.
3.1. Detecting translations (registering)
It is common for have slight translations from one frame to another (eg due to sligt camera movements). It is very important to align or "register" such images, since the default built-in "Copy-and-Adjust" algorithm is very sensitive to such defects. You can use an external program to align/register images beforehand, all the better (e.g. http://bigwww.epfl.ch/thevenaz/stackreg/). However, there is also a built-in algorithm for detection of translations, and if you haven't aligned the images externally, this is the first thing you must do in the segmentation process. The built-in algorithm is suitable only for translations, so if you have rotations or some other kind of transformations, you'll have to adjust such images externally.
Built-in algorith
Select the first frame and then click "Detect trans" button below the cell tree on the right. The program will ask you for a range (default = 20), this number specifies the number of pixels the program will 'slide' one image over the other (in every direction) in an attempt to align them. Start with default = 20 (bigger number = slower), you can later detect translation for just one problematic frame if you need to (with the higher value than 20). Translations will be saved to database and you will not have to do this again.
3.2. Define initial cells =
The built-in C&A algorithm tracks cells with regars to their position on the previous frame. This implies that you have to define the initial cells on the first frame, and start tracking from the second frame. To achieve that:
 * Open the first frame, and define bacteria. You click on the frame tree (right) and issue "Add" command to generate bacteria,
      and then you click on the bacterium and "Add" human ROIs (Regions Of Interest, i.e. selections)
Then you repeat the following (for each bacterium):
 * define ROI with ImageJ's polygon selection tool
 * click on the appropriate Human ROI node in the frame tree and issue 'Set Roi' command.
3.3. Segmentation and Tracking Algorithm
Before describing the tracking via built-in algorithm, a quick note on the BactTrack modular structure. BactImAs is designed to be a "platform for the cell segmentation and tracking" and should, ideally, be able to handle any such task. We recognize that there is no single algorithm suitable for all kinds of tracking tasks and have therefore enabled for various algorithms to be included in the BactImAs Platform and used for cell segmentation. While algorithm design is more a task for the developers (please, see Devs documentation), the user, on the other hand, has the option to use any of the available algorithms. Not only can different algorithms be used for different experiments, the user can assign different algorithms for different frames of the same experiment! Using the "Set Algorithm" command, a chosen algorithm can be assigned for any frame range. If not assigned, the default built-in "Copy And Adjust" algorithm is used. There is a "Fast Copy And Adjust" version of the algorithm available (not default) which differs from the default algorithm in the amount of information written to the log. The "Fast Copy And Adjust" writes minimal information and is therefore faster, however cell segmentation results are identical.
3.4. Segmentation and Tracking
Click on the frame (e.g. second frame) and issue 'Track' command. Enter the number of frames to process (default = 5). Track will attempt to segment the cells on the assigned number of frames starting from the selected frame. Each cell/frame is segmented using that cell's ROI from the previous frame. Human ROIs always have precedence over computer ROIs, e.g. if there are both human and computer ROIs on the previous frame, the algorithm will use human ROI.
When you issue the "Track" command you'll have the option of changing certain algorithm parameters. This is useful in situations when algorithm does not perform well.
 Parameters description:
 * "Ball radius" is a value in pixel that defines the size(radius) of the disk used to "draw" the cell. You may think of it as a radius of the tip of the broad ballpen used to draw the cell. In other words, this radius relates to the width of a cell - and you can measure that width W with ImageJ (or simply by zooming and counting the pixels yourself) and then assign the ball radius to just below the W/2. The default value is 4 which is appropriate for the cells of width 9, 10, 11...
 * "Channel" is simply the channel used for segmentation, or more precisely - images from the so labelled channels (folders) are used. Note that you can use e.g. blue channel for the first 10 frames, then green channel for the next five, then blue again, etc. In general, you want to use the channel on which the edge detection works best, you can try that for yourself using ImageJ or "Help decide" button below.
 * "Range" is a value in pixels relating to the possible elongation of the cells on their poles. If the algorithm doesn't catch up will cell growth on the poles, you may want to increase this number.
 * "Max ball delta perc" is given in percentages and defines the maximal additional area one disk can contribute when expanding the selection. If you find that the cells are erroneously growing to fast, "bubbling up" on the sides and poles, you may want to decrease this number.
 * "Threshold method" - the C&A algorithm relies heavily on the edge detection (and subsequent thresholding). If the algorithm performs badly, you may want to try changing the default method, you should choose the method that best outlines the cells (click 'Help decide' to see the gallery of methods).
Once you've set the parameters, the program will attempt to track the cells. You'll be able to see the segmentation as it happens and/or inspect it again using the "Reports" facilities:
3.5. Reports
There are two types of reports (and command buttons):
* "Color report" is a report (ImageJ stack) on which every cell is drawn in a different color, while background is drawn in black. Cell's offsprings will be drawn in the nuance of the parent-cell color, e.g. all descendant of the red cell will be drawn in nuances of red. Example: 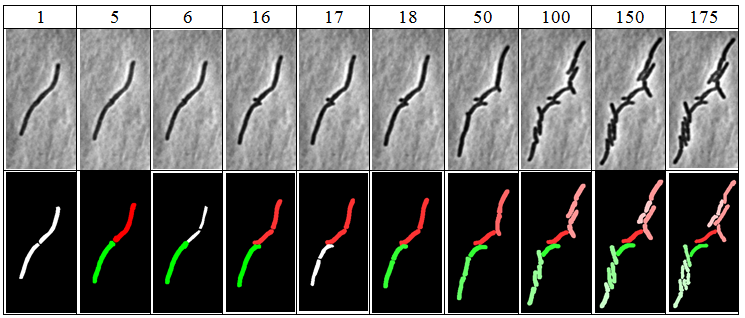

 * "Report" is a report (ImageJ stack) on which cells ROIs are outlined over original images. There is also a color/BW version of this report (you're asked to chose on click). BW report uses less memory as each of the stack's image is BW and, of course, BW use less memory than color images.
   * BW - human ROIs are outlined with white, and computer ROIs with black
* Color - human ROIs are outlined with green and computer ROIs with red, e.g.: 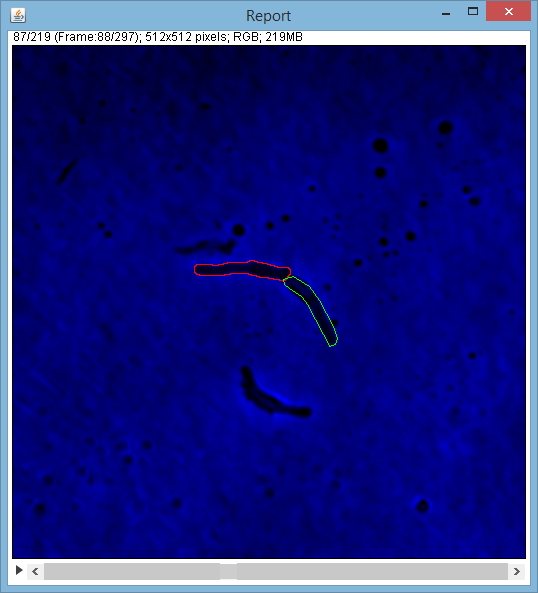

3.6. Cell divisions
For the time being cell division recognition is not supported and cell divisions are assigned manually in the following way:
 - Open the frame where bacteriium (e.g. bacterium 'B') is splitting
 - Click on the bacterium 'B' on the frame tree and issue "Split" command.
 - Program will replace this bacterium in the current frame with its two offsprings: 'BA' and 'BB'. They will both have the human ROIs defined (erroneously), you have to overwrite it:
   * Define ROIs with ImageJ's polygon selection tool for each offspring (and click "SetRoi" to save).
Split move/delete - If you made an error and defined split on the wrong frame, you can move the split up/down N frames, or even delete it all together. To move the split you have to select one of the children in the split frame, and click on the "Move/del split". E.g. let's say there is a split on the frame 10: A = AA + AB. QQ Click on either AA or AB and then click 'Move/del split'. The procedure is also thoroughly explained (in the program) when you click the "Move/del split" (and you have a chance to cancel if you change you mind).
4. Measuring
Once cells are segmented, various measurements are acquired in a fully automated way. BactImAs separates these two processes which has a nice side-effect that, for instance, cell segmentation and tracking can be outsourced or performed by a different person than a person taking measurements. Using BactImAs's (color) reports (described above), it is easy to visually inspect the quality of the segmentation process.
4.1. Background correction
Command "Set/msr bg (R+G+B)" is used to measure (store in the database) the background intensities of the red, green and blue channel images. These are used to compute the background corrected values afterwards.
After you click on this command an ImageJ stack will appear with all the frames of the experiment:
 Using this stack, user has to assign the (rectangular) background area (subarea of the whole image), typically the are of the image that never holds any of the cells.
As with other measures, one can chose whether to measure on the original tif images (recommmended) or the png images used for tracking and segmentation.
Status window displays the progress and acquired measures.
Using this stack, user has to assign the (rectangular) background area (subarea of the whole image), typically the are of the image that never holds any of the cells.
As with other measures, one can chose whether to measure on the original tif images (recommmended) or the png images used for tracking and segmentation.
Status window displays the progress and acquired measures.
4.2. Cell measurements
Cells are measured using the "Measure" command. User can chose to take any or all available ImageJ measures on the assigned channel (r,g,b). If you want to measure the same attribute on the different channels (e.g. mean on red and green channel) you have to measure twice: first on green and then on red channel (or vice versa). When saving measurements in the database BactImAs behaves in the following way: (a) if the same measurement on the same channel already exists - it is overwritten (b) otherwise, measurement is saved (added to the already existing measurements) So, in our example, green mean will be saved according to the (b) principle, and red mean also. Should you measure the green mean again, the initial green mean would be overwritten in accordance with (a).
Upon clicking on the "Measure", a user is presented with following dialog:

In the example above, the following will be measured:
 * Area on the red channel (though channel is irrelevant for area measure)
 * Mean on the green channel
 * IntDen on the red channel with **collar** of one pixel. **Collar** is the width of the outer rim belt you want to ignore (e.g. if you want to exclude the cell's membranes)
Typically, you want to measure area and mean on all channels.
Status window displays the progress and acquired measures. You can repeat the measuring process arbitrary number of times, or measure (repeat for) just a assigned number of frames, etc.
BactImAs provides a number of additional, derived measures, defined as follows: (note that you must first measure area, mean on all channels and background fluorescences on all channels for these measures to be available):
^Name ^Description ^Is numerical (= can be mapped to the lin. tree) ^ |generation |Stage of descent from a common ancestor | | |parent |Ancestor cell of a specific bacteria | | |sibling |Sibling cell of a specific bacteria | | |progeny_a |Specific progeny of a bacteria | | |progeny_b |Specific progeny of the bacteria | | |birth_time |Frame proceeding the division event |yes| |division_time |Frame previous to the division event |yes| |interdivision_time |=Division_time-Birth_ time |yes| |growth_rate |=(Area at division_time/Area at birth_time)/interdivision time |yes| |growth_velocity |=(Area at division_time-Area at birth_time)/interdivision time |yes| |area_square_microns |=Measured area* (pixel_width*pixel_height)/scale*scale |yes| |area_square_microns_growth |=(area_square_microns(n)-area_square_microns(n+1))/time |yes| |red_mean_bg_cor |=Red_mean-red_bg |yes| |green_mean_bg_cor |=Green_mean-green_bg |yes| |blue_mean_bg_cor |=Blue_mean-blue_bg |yes| |red_ctcf |=red_mean_bg_cor*area_square_microns |yes| |green_ctcf |=green_mean_bg_cor*area_square_microns |yes| |blue_ctcf |=blue_mean_bg_cor*area_square_microns |yes| |red_mean_bg_cor_change |=(red_mean_bg_cor (n)-red_mean_bg_cor (n+1))/time |yes| |green_mean_bg_cor_change |=(green_mean_bg_cor(n)-green_mean_bg_cor(n+1))/time |yes| |blue_mean_bg_cor_change |=(blue_mean_bg_cor (n)-blue_mean_bg_cor (n+1))/time) |yes| |red_ctcf_change |=(red_ctcf(n)-red_ctcf(n+1))/time |yes| |green_ctcf_change |=(green_ctcf(n)-green_ctcf(n+1)/time |yes| |blue_ctcf_change |=(blue_ctcf(n)-blue_ctcg(n+1))/time |yes|
Also, note the **"area_square_microns"** measure above, that stands for cell area in square microns of course. It is defined as: **Measured area * (pixel_width*pixel_height)/scale*scale** where:
 * Measured area is measured using ImageJ's "area" measurement (as shown above)
 * pixel_width, pixel_height and scale are per experiement values that can be defined via Experiment->Edit experiment
5. Other (misc) commmands
5.1. Deleting (truncating) ROIs
"Trunc (after)" is a rarely used option for deleting the ROIs for (after) a selected frame. Warning: deleted ROIs cannot be recovered and you'll have to detect them again.
5.2. Collapse/Expand all
These commands are used to collapse or expand all nodes in the Frame/cell tree.
5.3. Edit event
Using "Edit event" one can assign an arbitrary event at a certain frame (for instance, if the experiment conditions have changed, you may want to write that in the database).
The following dialog is shown:
![]()
Abbreviation is used to display the event in the tree, and the full desc is displayed in the lineage tree visualization.
If you want to delete the event, just edit it, and leave everything blank and the event will be deleted.
5.4. Change cell state
With "Change bact state" command you can assign certain state (e.g. "Ignore", "Death") to the cell from some frame onward.
 New state is annotated in the tree and on the lineage tree visualization.
To delete the assigned state, just set the empty state.
5.5. Toggle ignore frame
With this command you can ignore (or un-ignore) the selected frame. This is typically done when the frame if of a low quality (e.g. out of focus, unusable), but you want to keep it to keep the accurate timeline. Cells on the ignored frame are not measured nor does the frame appear in the CSV dump. When detecting cells on the frame F, the previous frame is considered to be the frame having maximal frame number f < F, such that it is not ignored.
6. Analyis and Visualization
6.1. Lineage tree visualization
BactImAs features the innovative lineage tree visualization that can map two, user selected, parameters to the cell division tree. When you're done with measurements, choose Reports->BTree from the main menu. The following dialog appears:

It is possible to assign any of the measured (and derived - built in) variables to the two visualization properties: branch width and color. Dialog shows the area of the cell mapped to the branch width, and green_ctcf mapped to the branch color. Other than that, it is possible to assigne the following parameters:
 * seconds per frame - used for the time scale on the right, where t(frame_no) = (frame_no-1) * seconds_per_frame
 * min/max stroke width - min/max parameters on the branch color are scaled to min/max stroke width
 * font size
 * draw labels - whether to draw the cell labels
 * convert to hours - whether to convert time in seconds to format: HH:MM:SS
BactImAs will draw a separate visualization for every cell present on the firt (non-igored) frame. The following image shows a sample visualization from the demo database:

It is our intention to include in the new version of BactImAs additional out-of-the-box statistics and visualization.
However, acknowledging that it will never be possible to cover all potential requirements, we've enabled the following option:
6.2. Export data as CSV file
With Reports->Dump CSV one can export the experiment's data into a CSV file and proceed to analyze it in one's favorite data analysis tool.
After you assign the file name, the following dialog appears:

with all the available measurements for the experiment.
6.3. SQL Pane
BactImAs stores all the data (except images) in the SqLite database. Database can be accessed using any of the SqLite client tools - there are many such tools freely available on the Internet. It is also possible to access it using the simple built-in SQL Pane editor, which allows for arbitrary SQL statements (queries) to be executed and displayed in a table, and even exported as CSV. The following figure shows the SQL pane:

Of course, to use SQL pane one has to know the SQL programming language. It is our intention, for the future releases of BactImAs, to build a library of predefined SQL queries, with adjoining descriptions in natural language, so that a user that has no knowledge of SQL language can pick from the set the available predefined queries and retrieve results for his or hers experiment.
7. Backup, upgrade and data exchange
7.1. Backup
To backup the data one should simply copy the "data" directory to a safe place, every once in a while.
7.2. Upgrade
When upgrading BactImAs, it is best to: (a) extract new BactImAs version into a new folder (b) copy the old version's data folder over(write) the new version's data folder.
7.3. Data exchange
(see also the BactImAs structure in the User->Installation) To exchange data, it is necessary to exchange database and images folder (best zipped).

Should person A want to send experiment data to person B, these are the steps to follow:
 * Person A sends the images folder (best zipped) to person B. Person B saves (extracts) them to person B's images folder. One could use cloud storage for this steps (eg Dropbox, GDrive) as images are too big for email.
 * Person A sends the BactImAs.s3db file (database) from dbs folder to person B. Person B potentially renames it (to avoid clashing with person B's database), saves it to the dbs folder, and adjust the URL in the conf/db.properties to point to this new database (see User->Installation)
The second step can be repeated if there are new data measured in the database, while the first step needs to be done only once.